
Heat is America's greatest weather-related public health threat, according to the U.S. Centers for Disease and Control, which has created a new tool to highlight the drastically different effects extreme temperatures can have on San Diego County's most vulnerable communities.
The CDC's Heat and Health Vulnerability Index assigns a percentage ranking to each U.S. ZIP code based on how negatively impacted their residents will be by heat. The tool determined that several San Diego County communities are in the top 10% of the country's most vulnerable.
"Exposure to high temperatures is related to a large number of illnesses and deaths each year," CDC epidemiologist Amy Lavery said. "Last year was the hottest year ever recorded in the U.S. and globally, and because of that, we wanted to develop a tool that would help jurisdictions prepare for and prevent heat-related illnesses and deaths."
Who are the heat vulnerable?
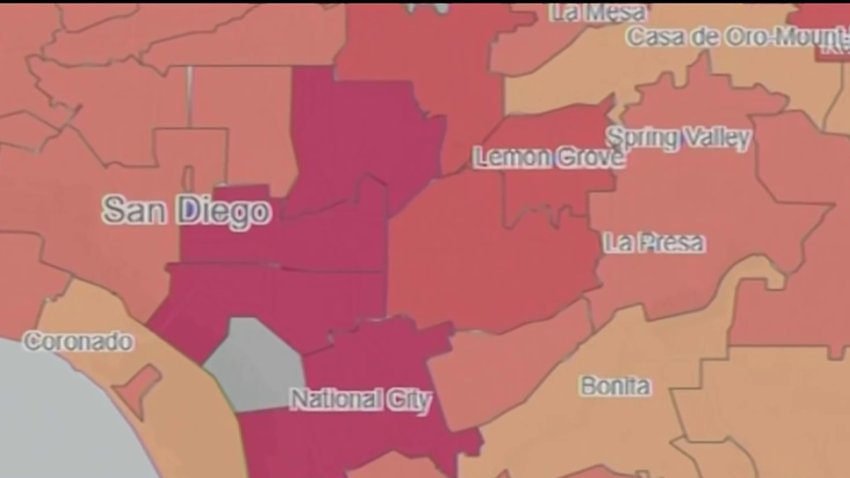
Among the most vulnerable areas identified by the CDC are the rural inland North County communities of Pala (92059) and just south of Warner Springs (92070); Borrego Springs (92004); and the border-adjacent communities of San Ysidro (92173), Potrero (91963), Campo (91906), and Live Oak Springs (91905).
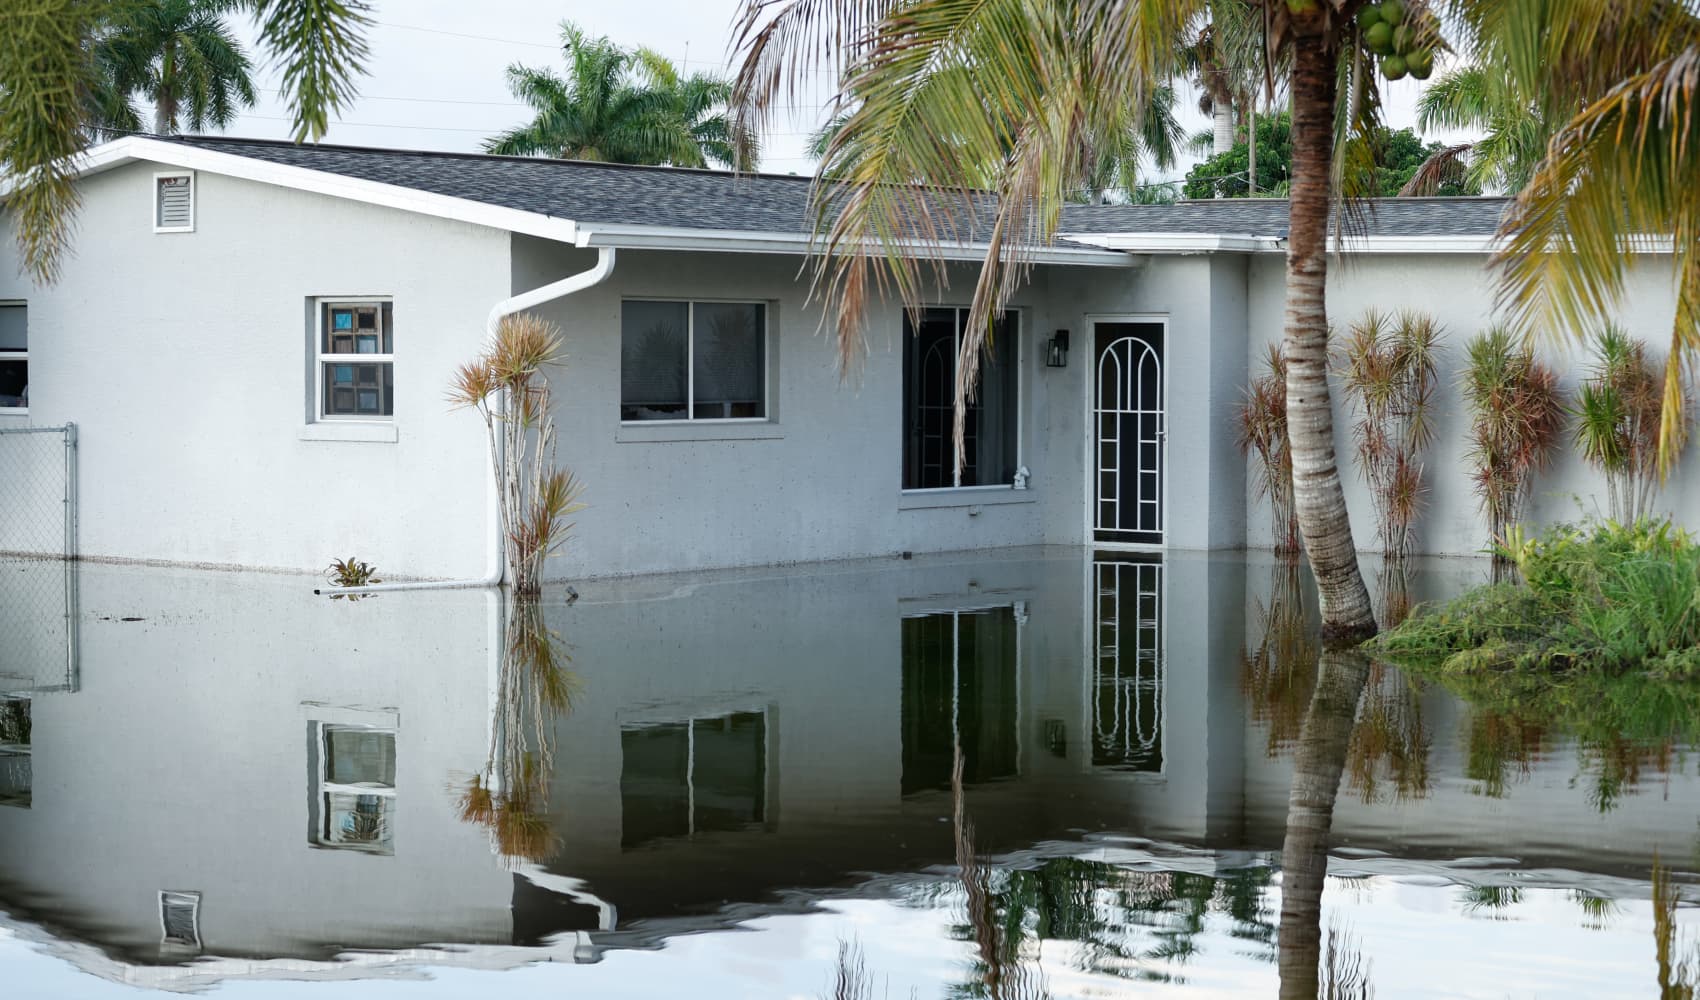
Also included is the stretch of ZIP codes from San Diego's Barrio Logan to City Heights, along the Chollas Creek (92102, 92105, 92113) -- and North National City (91950). The same area was impacted earlier this year by another extreme weather phenomenon when a severe January storm sent millions of gallons of water through the creek, flooding hundreds of homes.
Take a look at the map's data below. The full tool can be explored on the CDC's website here.
Following the data
To determine a ranking, the Heat and Health Vulnerability Index uses a plethora of data to determine how many extreme heat days -- days with above-average temperatures -- a community will experience. It then analyzes a ZIP code's demographics based on more than two dozen factors, including pre-existing conditions, socio-demographic factors like age, health insurance and poverty level as well as natural and environmental factors, which can include the number of trees in an area and street surface conditions.
"The unique piece about the Heat and Health Index is that it can analyze the unique local factors that may be contributing to heat-related illness and death, and allow for targeted intervention strategies," CDC epidemiologist Amy Lavery said. "We're hoping that this tool is something that jurisdictions can use to identify and prioritize areas that may need special attention during heat-related events."
The CDC isn't making any groundbreaking revelations with their new tool. Research shows communities of color, lower-income, and older populations are harder hit by extreme weather events due to a multitude of factors. The particular topic of the heat's effect on vulnerable populations has been studied by UC San Diego researchers searching for solutions to inequities. The goal of the CDC's tool is really to pinpoint exactly who is most vulnerable and why in order to inform city policy and public health action, the agency said.
"For example, if you have ... children who could be at risk, then things like school heat policy, like working with the local jurisdiction, come up with school heat policy, you could look at recess, not during the hottest parts of the day," said CDC senior health scientist Rish Vaidyanathan. "If there is an area within the city which do not have sufficient modes of transportation or people don't have vehicles, maybe figuring out ways to transport people to cooling centers if temperatures are really high."
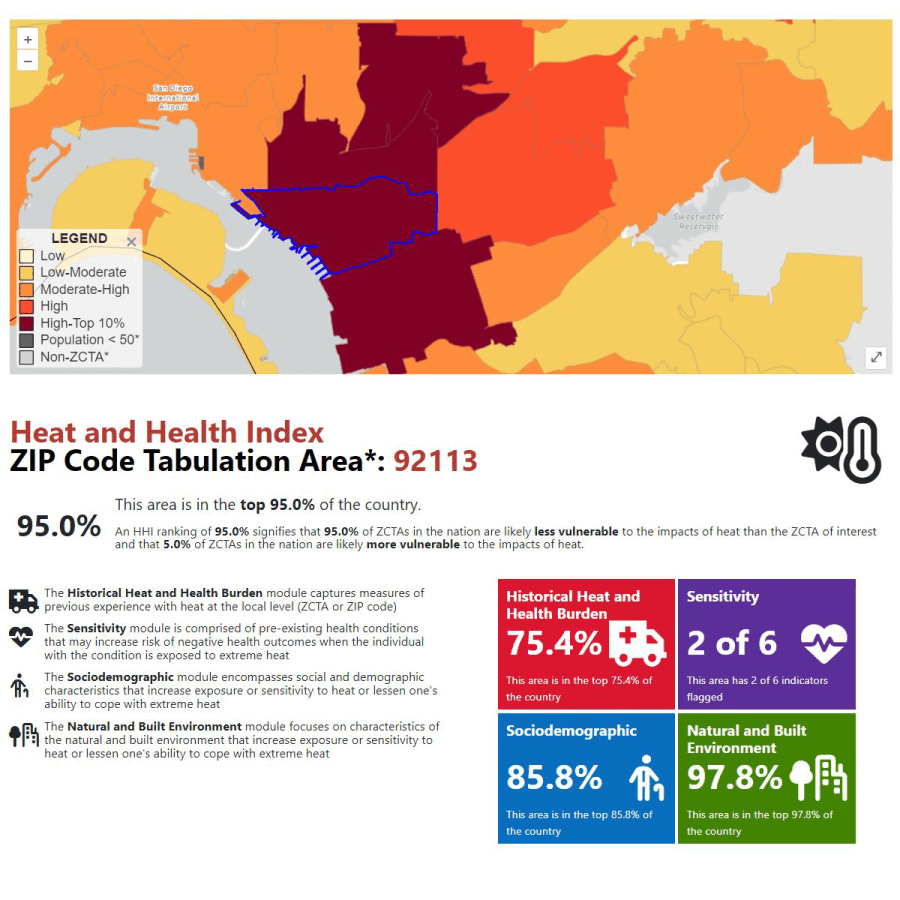
A community with a 95% ranking -- like the 92113 ZIP code encompassing Barrio Logan, Southcrest and Mountain View, for example -- is more vulnerable to the impacts of heat than all but 5% of the country's ZIP codes. Contributing to the burden, according to the CDC, is absorbent roads in the worst 98.8% of the country, a tree canopy in the worst 87.5%, a population that lacks vehicles and made of renters that could lack access to adequate air conditioning.
On top of that, the majority of the community lacks health insurance, speaks English "less than well," has more children on average and experiences more poverty and unemployment -- all factors that make those residents more vulnerable to other extreme weather events as well, like January's floods.
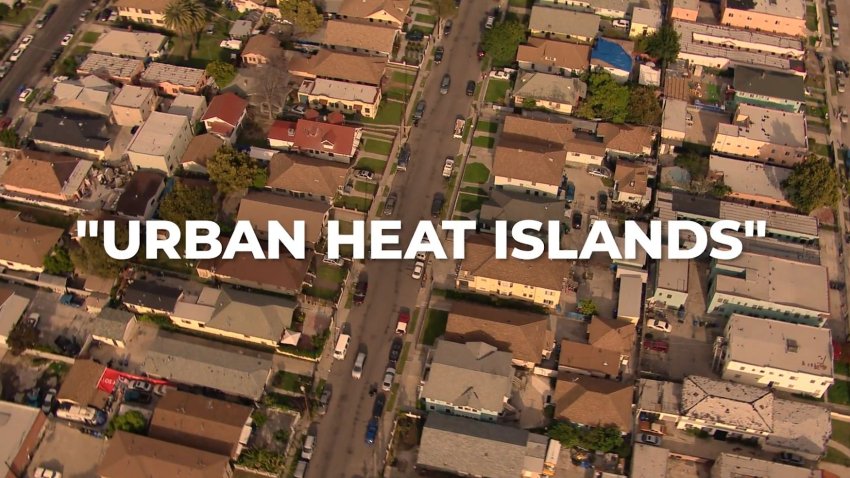
The city of San Diego says they are focusing on heat inequity when making policy decisions. A 2021 study the city conducted on Urban Heat Islands -- areas where there is more heat exposure due to surface temperature, lack of tree cover and other environmental factors -- identified the Mid-City areas as being particularly vulnerable. It's one of the reasons the city is looking to have 28% of the city under urban tree canopy cover by 2030 and the reason there are about a dozen Cool Zones, which include all San Diego Public Libraries, within a 5-mile radius of the Mid-City area.
The burden beyond the numbers
Beba Zarate has lived in Shelltown, within the same 92113 ZIP code, for the last 25 years and is one of hundreds of Mid-City residents still repairing their homes from January's historic flooding. For Zarate, escaping the heat as it approaches the 100-degree mark like it has this week isn't as easy as closing blinds and blasting fans when she lacks a car.
"You say, 'Well, I have the fans.' Where do I go? Do I go to the libraries where there is ice zone, where you can be, like, cool? But sometimes you have to walk or take public transportation and so I say, 'Well, maybe I stay here," Zarate said.
"Either you say, 'Well, do I renew and start kind of working on what other things I have to get done to have a safe place to be and sleep and stay with my family? Or do I have to get an a/c for the family?"
Julia Chase, San Diego's Chief Resilience Officer, studies the impacts of climate change-driven hazards to better prepare the city for future extremes. Part of the Climate Resilient SD plan focuses on strategies to mitigate the effects of heat and enhance the capacity for the city to respond to heat events, particularly in those vulnerable areas that San Diego calls "Communities of Concern."
"Those are the areas that we're looking to prioritize for implementation of those heat mitigation strategies. And I think there's real opportunity there as we're thinking about heat mitigation to also think about where there's that flood resilience. It's really helpful for us to think about strategies that are going to address both," Chase said. "So things like green infrastructure that might help absorb or slow those floodwaters but will also help keep communities cool because you're adding that green space component.
Why it matters
Extreme heat days, those when temperatures are above historical averages, are the leading cause of weather-related deaths. An extreme heat day for San Diego is when temperatures exceed 93.1 degrees, according to the city. National Weather Service data shows there have been three, so far, this year: in January, August and on Thursday of this week.
Vaidyanathan highlighted that looking at the length of heat waves is just as important as looking at temperature extremes since heat exposure can occur over a number of days. Over the last four decades, heat waves in California have risen in frequency, intensity and duration, according to UC San Diego. This week's heat wave is expected to put most of San Diego County under an excessive heat warning for at least six days, from Wednesday to Monday of next week.
Using data from the last 40 years to analyze average heat value in the summer, the CDC predicts how many extreme heat days an area is expected to experience in a month.
"Specifically in the western U.S., we're seeing increases in deaths and illnesses that are due to heat and both direct and indirect effects of heat-related exposures," Vaidyanathan said. "We had close to 120,000 emergency department visits due to heat that are observed nationwide. But that number was higher than what we saw for the last five years."
Climate Change


Over the last 10 years, the globe has warmed about 1.19 degrees Celsius (2.14 degrees Fahrenheit), according to the report in the journal Earth System Science Data. By 2040, San Diego could be 5 degrees Fahrenheit higher on average than it is now, the city said.
The rate Earth is warming hit an all-time high in 2023, according to a team of nearly 50 scientists that determined last year was 1.43 degrees Celsius warmer than the 1850 to 1900 average, with the majority of that change coming from human activity. The remaining 8% of the change was attributed to it being an El Nino year.
Warming at a rate more than 1.5 degrees Celsius a year won't wipe out humanity but could create massive changes to the Earth's ecosystem, scientists told NBC News. It could mean the loss of coral reefs, Arctic sea ice and certain species of plants and animals as well as more extreme and deadly weather events.
"We're going to start living at the extremes," NBC 7 Meteorologist Greg Bledsoe said. "As the earth gets warmer, we're going to see drier, more prolonged droughts. We're also going to see wetter winters, so when we have those wet winters, they're going to be really wet. When we have those dry, warm summers and years when we're in drought, they're going to be longer and drier."
NOAA says Earth's temperature has increased at an average rate of 11 degrees Fahrenheit per decade since 1850. And 2023 was the warmest year on record. This year is likely to surpass it.
Editor's Note: This story originally stated the city of San Diego planned to plant about 70,000 trees by 2030. That is a County of San Diego goal. The city's Climate Action Plan has a goal of 28% tree cover by that year.