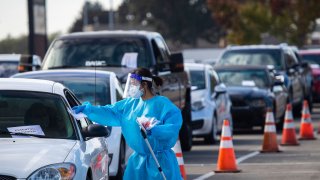
San Diego County health officials have reported a huge jump in COVID-19 cases -- a record 1,087 -- and no additional deaths, bringing the county's totals to 64,768 cases and the death toll remaining at 926.
Sunday was the fifth-consecutive day that more than 600 new coronavirus cases were reported by the county.
On Saturday, the county set a record of 736 new cases. On Wednesday, a record 661 cases were reported in the county -- surpassing the 652 cases reported Aug. 7. Another 620 cases were reported Thursday.
“We have not seen cases this high in months, and it's a clear indication that COVID-19 is widespread,'' said Dr. Wilma Wooten, the county's public health officer.
“These totals also show people are not following the public health recommendations that we know work to prevent getting and passing COVID-19.”
Wooten added that in the weeks following Halloween, this record case jump is a warning sign people “need to follow public health guidance throughout the upcoming holiday season.”
This comes as state data has landed the county in the most restrictive tier of the state's COVID-19 reopening plan. The restrictions associated with the purple tier went into effect just after midnight Saturday.
Local
Many nonessential businesses are now required to move to outdoor-only operations. These include restaurants, family entertainment centers, wineries, places of worship, movie theaters, museums, gyms, zoos, aquariums and cardrooms.
The restrictions include closing amusement parks. Bars, breweries and distilleries will be able to remain open as long as they are able to operate outside and with food on the same ticket as alcohol.
Retail businesses and shopping centers can remain open with 25% of the building's capacity. No food courts will be permitted.
Schools will be able to remain open for in-person learning if they are already in session. If a district has not reopened for in-person learning, it must remain remote only. Offices are restricted to remote work.
Remaining open are essential services, personal care services, barbershops, hair salons, outdoor playgrounds and recreational facilities.
The county's demotion from the less-restrictive red tier is the result of two weeks of case rates that exceeded the threshold of 7 per 100,000 residents.
In recent weeks, the region had an unadjusted rate well above the purple tier guidelines, but a significant effort to increase the volume of tests had allowed for an adjustment to bring it back to the red, or substantial, tier.
State officials reported Tuesday that San Diego County had an unadjusted new daily coronavirus case rate of 10.0 per 100,000. The adjusted case rate dropped to 8.9 per 100,000. Last week's unadjusted case rate was 8.7 per 100,000.
According to the reopening plan, a county has to report data exceeding a more restrictive tier's guidelines for two consecutive weeks before being moved to that tier. A county then has to be in that tier for a minimum of three weeks before it may move to a less restrictive tier.
Even as the number of cases climbs, the testing positivity rate for the region continues to decline. From last week's data, it dropped to 2.6%, a 0.8% decline. It still remains high enough for this metric to remain in the orange tier.
The state's health equity metric, which looks at the testing positivity for areas with the least healthy conditions, increased from 5.3% to 6.5% and remained in the red tier. This metric does not move counties backward to more restrictive tiers, but is required to advance.
Of the 14,663 tests reported Friday, 4% returned positive, increasing the 14-day rolling average of positive tests to 3.8%.
Of the total number of cases in the county, 4,154 -- or 6.6% -- have required hospitalization and 947 patients -- or 1.5% of all cases -- had to be admitted to an intensive care unit.
The number of community outbreaks in the past week was reported at 44 as of Saturday.
The county launched a COVID-19 case rate map Thursday showing how cities and communities are being impacted by the novel coronavirus. The interactive map allows users to identify the case rate per 100,000 residents in cities and communities or by ZIP codes.
The map also shows where each area falls under the different state tiers and whether their case rate and testing positivity are going up or down.
The map can be found here.


